
In the 5 weeks following Holiday 2020, retail credit and debit card sales were up about 20% year over year (YoY). By comparison, post-Holiday 2019 only grew by about 10%. So what is driving this post-Holiday 2020 growth for retail?
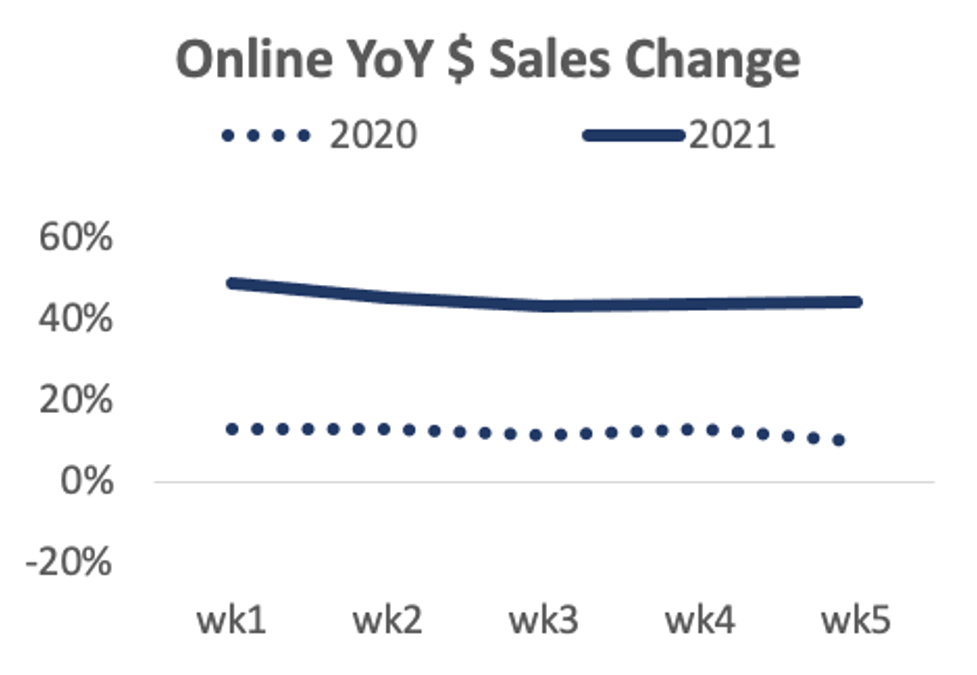
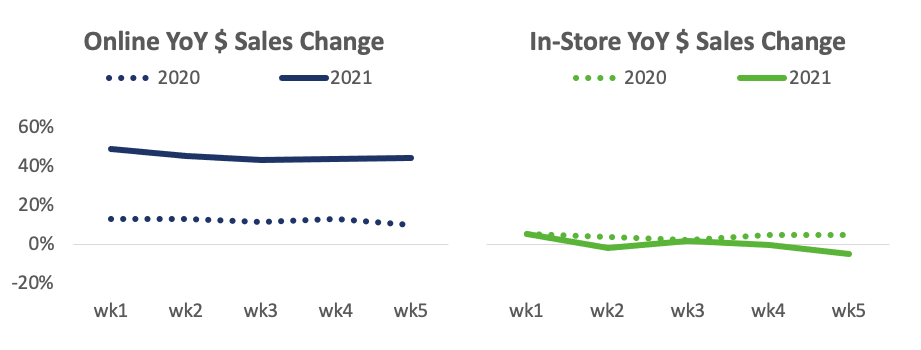
Online sales during this time period showed significant growth over last year, up an average of 45% each week. Considering online sales only grew by about 12% post-Holiday 2019, this continues to fuel the shift towards e-commerce. On the other side, in-store sales showed average declines of 1% over the previous year. This looks slightly better than overall in-store sales trends given the shift by more consumers using cards over cash these days.
What does this mean for merchants?
As social distancing continues to be the norm, consumers continue to lean heavily on e-commerce to get the products and services they need. Merchants should continue to support this trend with comprehensive online offerings, curbside pick-ups, and at home deliveries.
Next, we will examine the industry verticals which drove these changes for retail.
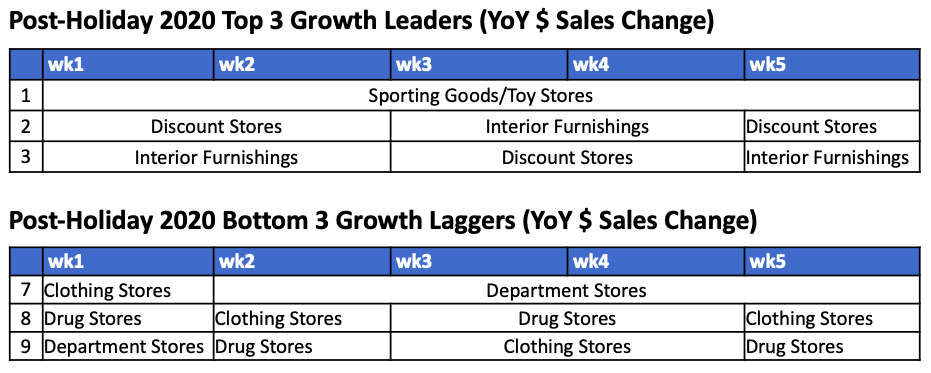
Generally speaking, the post-Holiday 2019 Retail Leaders and Laggers were:
- Top 3 Growth Leaders: Discount Stores, Wholesale Retailers, and Interior Furnishing Stores (includes Home Improvement)
- Bottom 3 Growth Laggers: Clothing Stores, Electric Appliance Stores, and a mix of Drug & Hardware Stores
Looking at post-Holiday 2020 Retail the list looks a little different:
- Top 3 Growth Leaders: Wholesale Retailers drop out and are replaces by Sporting Goods/Toy Stores
- Bottom 3 Laggers: Electric Appliance Stores move up and get replaced by Department Stores
What does this mean?
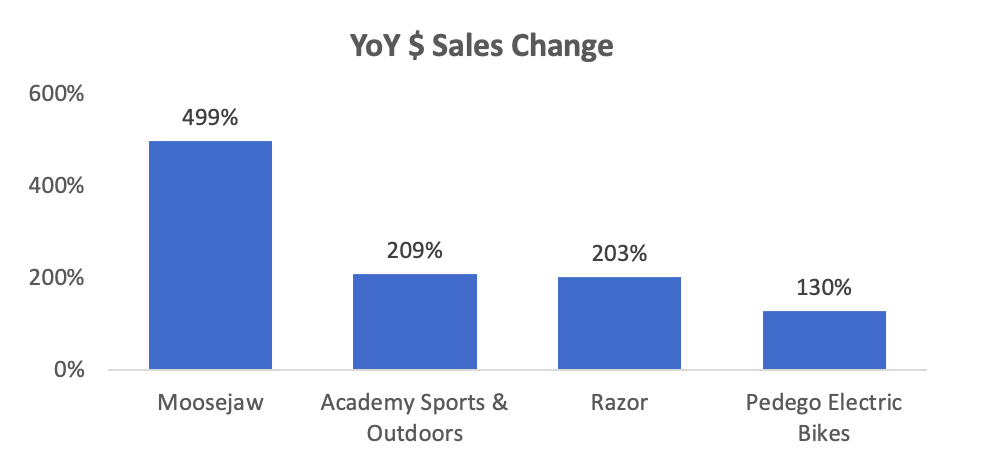
During Covid last year we saw increased spending on Sporting Goods/Toys categories as consumers were looking to find way to self-entertain (and occupy their kids) while at home. Sales for Sporting Goods were also supported by people buying equipment to keep up their fitness routines at home.
Looking at post-Holiday 2020, it appears that this category is continuing its popularity trend showing an average 59% growth YoY in the weeks following the Holidays with four retailers even showing triple digit growth. This compares to a modest 6% growth for the industry in 2019.
The growth for retail however comes at the expense of other typical post-Holiday growth categories which we will review next.
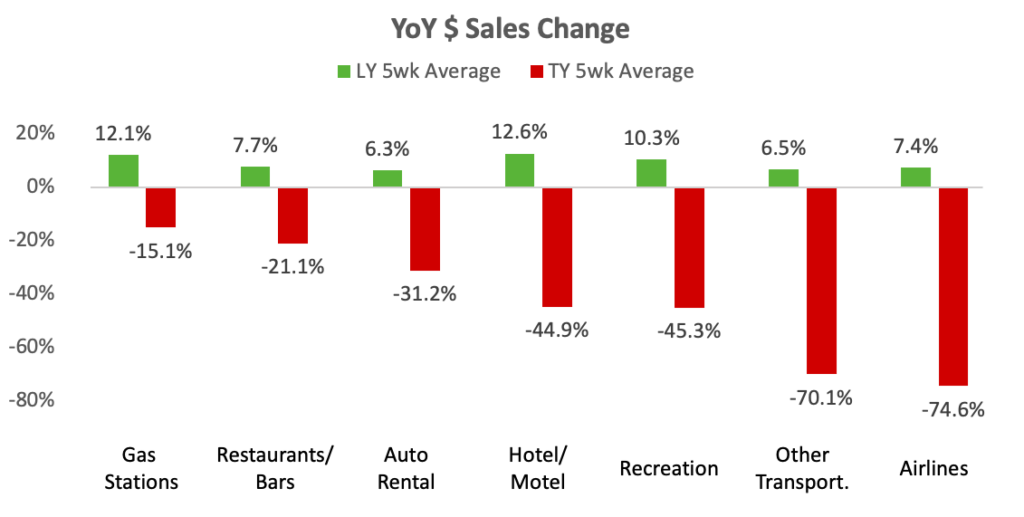
The start of a new year typically means the kick-off of vacation planning as people begin looking forward to the coming warmer weather of Spring and Summer. This is why we usually see strong post-Holiday growth for industries such as Airlines, Hotels, and Auto Rentals. For example, Airline sales grew by an average of 7% in the 5 weeks following Holiday 2019 but was down 75% post-Holiday 2020.
While retail seems to be winning post-holiday 2020, some of this growth is likely coming at the expense of decreased spending in Entertainment, Travel, and Restaurants.
Summary
- Total Retail sales remain positive in the weeks after Holiday 2020, and this is driven by the strength of e-commerce sales growth.
- Sporting Good/Toys Store merchants continue their trend of growth from 2020 into 2021. With Covid sticking around, we expect this to last as staycations will remain a popular way for some downtime until we can return to travelling again.
- Industries associated with Entertainment and Travel continue to be hit hard by Covid-19 social distancing protocols. That said, look for these industries to have a big come back once more widespread vaccinations are in place and people look to escape hibernation.
Methodology & Terminology
- Retail industry includes sales transactions from: Clothing Stores, Department Stores, Discount Stores, Drug Stores, Electric Appliance Stores, Hardware Stores, Interior Furnishing Stores, Sporting Goods/Toy Stores, Wholesale Retailers
- Last Year (LY) includes sales transactions from 12/29/2019 – 2/1/2020
- This Year (TY) includes sales transactions from 12/27/2020 – 1/30/2021
Consumer Spending Trend Data
For weekly updates on consumer spending by category, state/county, online and offline, check out the Commerce Signals Consumer Spend Impact Tracker. Much of the data in this article is pulled from it. Merchant specific data is from Commerce Signals Merchant Tracker. Both Trackers are updated weekly. Contact us for more information or a demo.